
The Data Says Mentorship is Money
A decades-long study by Big Brothers Big Sisters highlighted the lasting impact of mentoring. The research followed two groups for 30 years: children who were mentored and a control group of children without mentors. Children with mentors were 20% more likely to attend college and enjoyed a 15% increase in lifetime earnings. Big Brothers Big Sisters used data to demonstrate that volunteering to be a Big leads to lasting change.
Nonprofits dream about proving their impact in this way, but it isn’t easy – especially for newer organizations that don’t have decades of data to draw from.
Collect Data That Tells a Story
If you want to bolster your story with evidence, you have to collect data. But it’s difficult to collect data well. I often complain about nonprofits who create ridiculously long surveys. If you ask 25 questions on a survey and make all the fields required, you are making the world worse. That’s my hot take, and I stand by it. (I complain more about this here.)
On the other hand, the best stories are grounded by data. Here are a few simple ways to track data without asking people a bazillion questions.
Consider Using Proxies Like Zip Code
The zip code we were born in is a powerful determinant of future socioeconomic factors (see Opportunity Atlas). If your organization works locally, such as around literacy rates, frame your work by zip code and compare it to similar areas.
When talking to participants, ask for their zip code (and little else) to tell this type of story.
Use External Data
Another option is to frame your work based on data you don’t have to collect. For example, the Kansas Health Foundation tells the story of health in Kansas – and the work they’re doing to improve it – using national health scores by America’s Health Rankings. They didn’t have to collect the data to tell this story! They’re drafting off the brilliant work of others.
If you want to help create more first-generation college graduates, use national or regional benchmarks to show the current disparity and track your success rate over time.
Sometimes Zero is the Best Metric
Think of manufacturing plants with the sign that says: “342 Days Since Last Injury.” That means there have been “0” injury-causing accidents in the workplace. So easy to track!
If you work with foster kids—who are notoriously moved from house to house all the time—maybe your metric is the number of moves in a time frame, with a goal of keeping it as low as possible.
Don’t Forget Qualitative Data
Rich stories often come from stakeholder interviews and open-ended questions. Data doesn’t always mean numbers.
Sometimes, the best data is three sentences about how a life was transformed. Asking people a simple fill in the blank question is a great way to unearth these stories.
“Before {your intervention} I was… and now I am…”
With framing like this, the story writes itself.
Join the Next Tech Savvy Nonprofit Cohort
To tell any story with data, ask yourself: “What story do I want to tell in 30 years?” Collect that data – and start tracking it now.
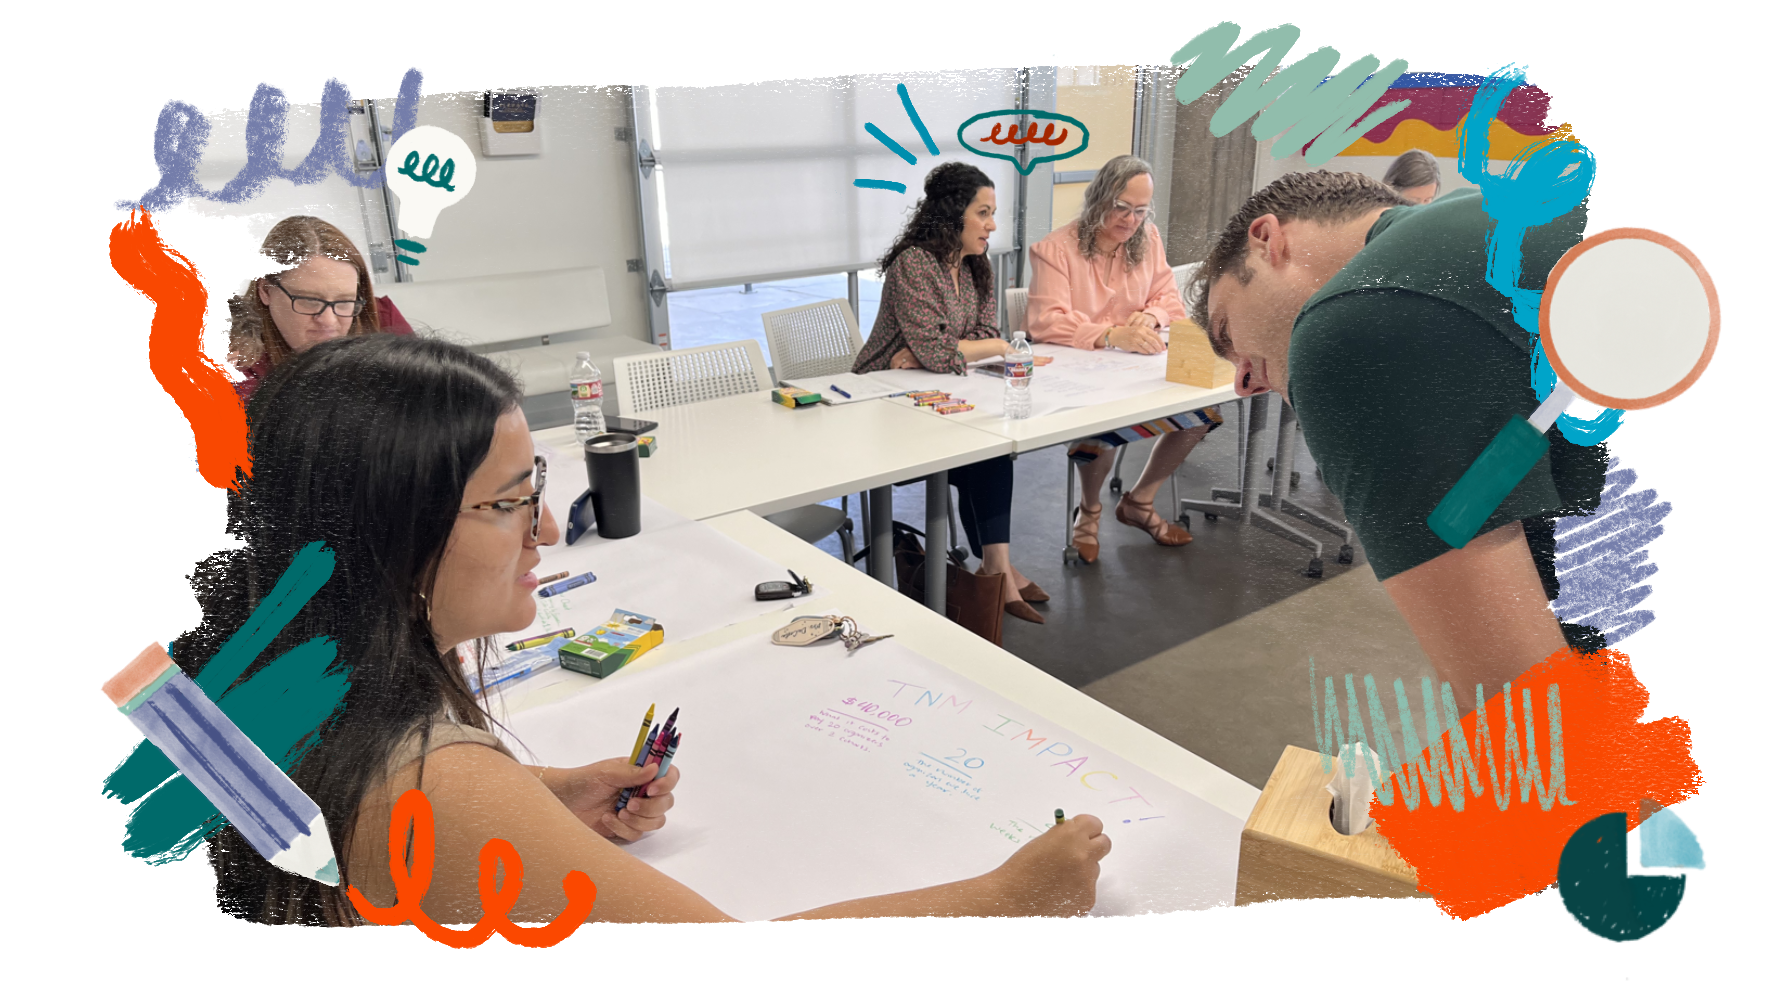
One of my upcoming Tech Savvy Nonprofit Cohort sessions discusses using data to show impact. We cover challenges nonprofits face when measuring impact, questions to ask before collecting data, and some simple ways to report it.
If you want to join me for the Spring 2025 Cohort (starting March 4!), learn more and sign up here: https://www.tedkriwiel.com/cohorts. Let me know if you prefer to see my face in person or on Zoom. I go where I’m wanted!